At Last.fm, we enjoy being mad scientists, playing with data and infographics — stay tuned for more in the visualization department!
via Last.fm – the Blog · Mad Science + Awesome! = New playground apps.
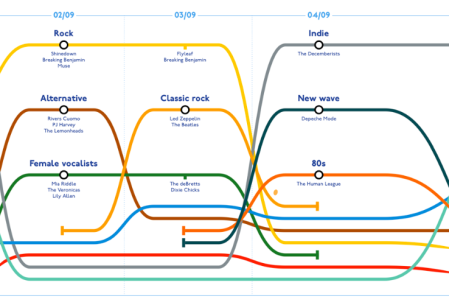
The “Tube Tags” map snipped above is a visualisation of alter‘s listening habits, using music tags and related artists as this fictional Tube main lines and stops, and changes as lines directions (so e.g. as I was listening more of Mozart the corresponding classical music brown line goes up or “North”, and the same for the yellow “Folk” line as more of Stefano Miele was scrobbled).
The link above from Last.fm official blog has more on the topic — in short, the team has beefed up the service “playground” area with some new visualisations, available only to subscribers but visible to everyone.
I like the idea very much, even though no practical implication is evident at the moment — or maybe exactly for this reason. This is also really on the same lines that were discussed in Vertigo, a conceptual design and exploratory research work on which I have been active over the last few months (in Vertigo the scope was larger than music and included movies, pictures, linear media in general).
I am fascinated by the idea that visualisations can be informative and entertaining at the same time. It’s a blend of functional and aesthetic (or edonistic) values that to me is badly needed in the digital space, where they are often separated (so that you might have applications or services that are either overtly functional or overtly easthetic-driven, or let’s say dominated by formal technological and media experimentation — not a bad thing as such of course! in both instances).
See here below another example, a collage of top artists pictures (again, alter‘s view).
9th of November 2013 update: the pics originally inserted into this post got lost in this blog Oct. 2013 crash, so I replaced them with the one below, taken from the Visualizing Music blog – thanks them! not that I asked before…)
via Last.fm – the Blog · Mad Science + Awesome! = New playground apps.
